Three moves take you from a lot you're guessing about to a lot you manage in real time: sensors sense, the Console manages, the app guides. No gates, no guesswork, no PII.
One connected loop: hardware sees every space, software makes it usable, and drivers feel the difference the moment they arrive.
Wireless, battery-powered sensors and lane counters detect each stall and every vehicle, covered, ADA, EV, and curbside included.
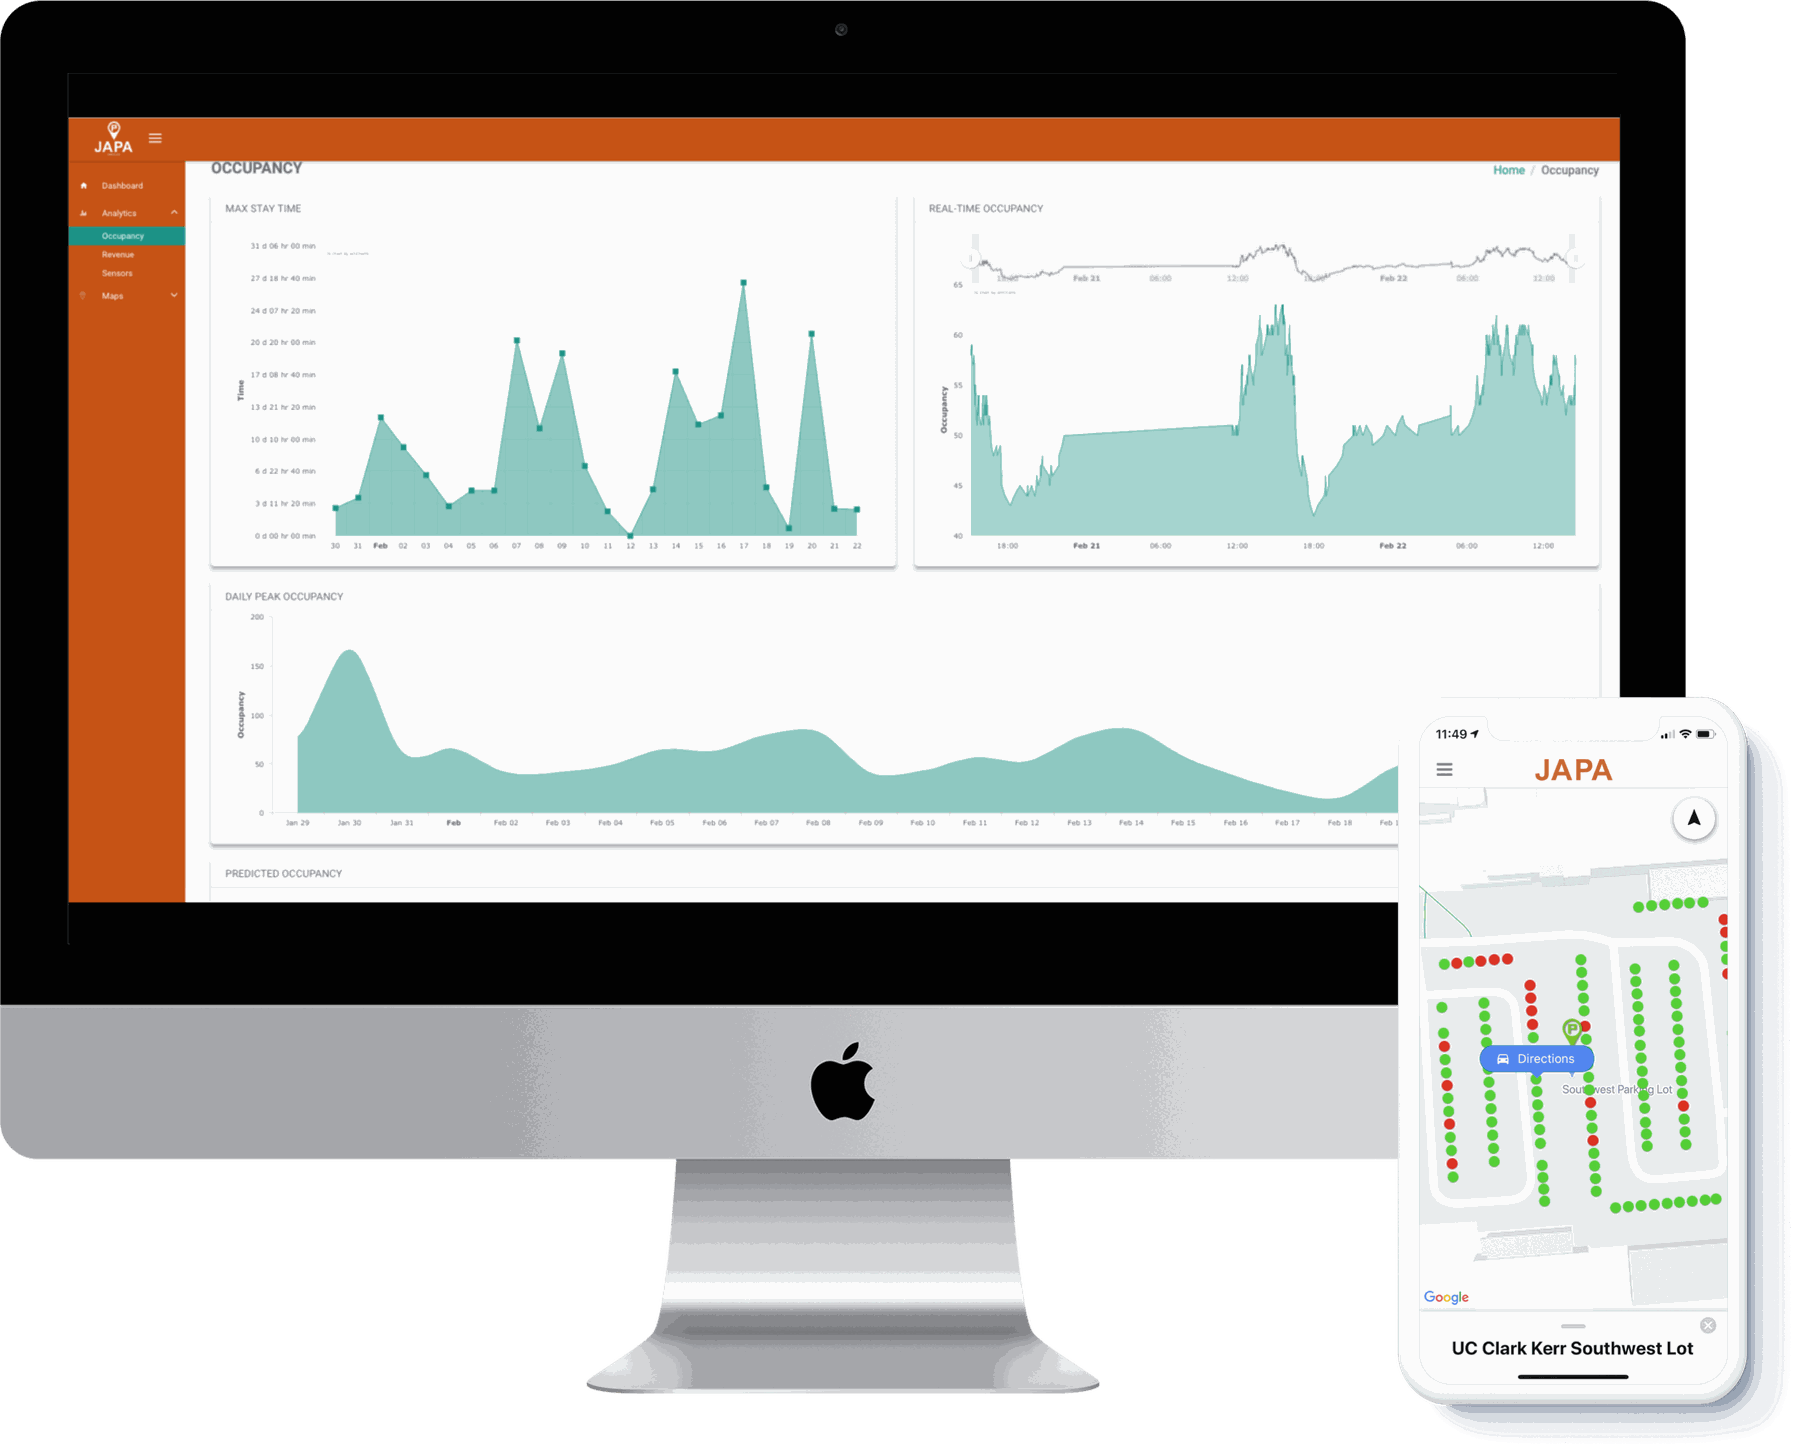
Every reading streams to a live dashboard: occupancy, dwell, lane counts, and overstay, with alerts the moment a zone fills.
A branded map points drivers straight to the nearest open space and navigates them there, cutting circling and frustration.
Wireless IoT sensors and lane counters detect each stall and every vehicle that passes, including the covered, ADA, EV, and curbside spaces other systems miss. Readings travel over the air to the cloud, and out to your Console, the driver app, and any city or campus service you connect.

Our fully wireless sensors mount to the surface and connect over the air, so there's nothing to dig, wire, or rebuild. That cuts installation cost and time dramatically and gets your lots live faster, with zero disruption to operations.
Sensor data streams into the JAPA Console, the dashboard your team actually opens. See live occupancy by lot, level, and zone, track dwell and turnover over time, and get alerted the second a zone hits capacity or a sensor drops.


The same live data drivers can't see from the street shows up in the JAPA app: it points them straight to the nearest open space and navigates them there, cutting circling, emissions, and frustration.
Private by design. JAPA reads occupancy, never identity. Nothing to breach, nothing to subpoena.
Because there's no civil work, the gap between "we signed" and "we can see every space" is measured in days.
We map your lots and plan sensor and lane-counter placement with your team.
Pre-configured sensors and counters arrive ready to mount, no setup required.
Sensors go down without trenching, wiring, or closing a single lot.
Your dashboard lights up with real-time occupancy across every monitored space.

Let's map every space on your property, and show your team what real time really looks like.
Get a demo